A COMPUTER INTERFACE TO DEMONSTRATION EXPERIMENTS
A PC with an analog-to-digital input board is used to display real-time results from several of the laboratory demonstrations. This document contains a description of this facility and how to use it. The software written by Mr. Scott Kittelman.
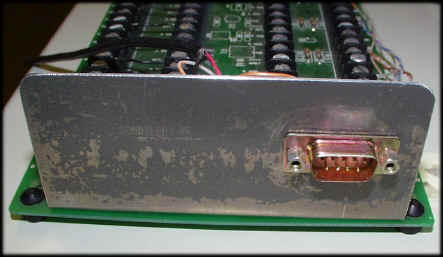
The interface computer is a PC with an analog to digital board made by Data Translation. This board accepts voltages from sensors in various demonstrations and converts them to digital data. All the experiments that use this facility have a connector that should be attached to the computer interface input port shown below.
The computer itself is usually setup using the steps outlined below. Once the setup is done the connector for the LCD video panel is removed and replaced with a cable going to the class-room video projector display. Of course, if you are showing something to a few people the 14" LCD panel is probably good enough.
When the computer is switched on just hit ESC for any Windows message that comes up while the machine is booting. After Windows comes up, click on the icon for DemoGraficsDisplay.
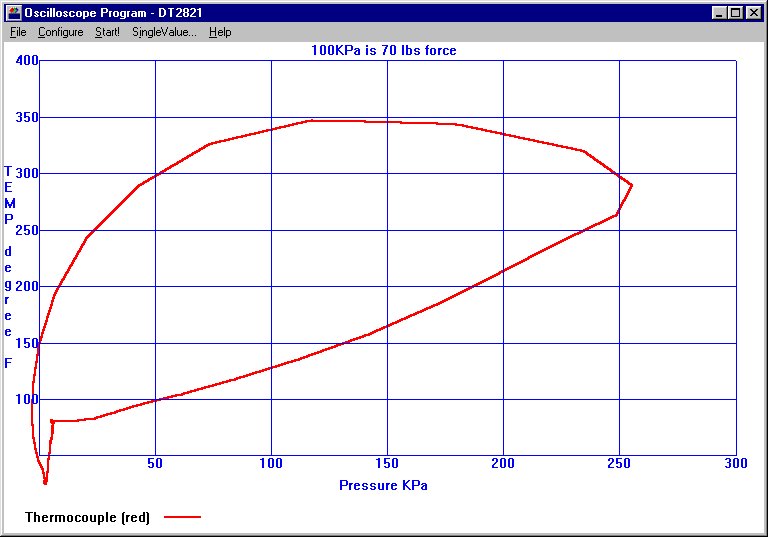
You should get a screen that looks like that shown below (but without the graph).
To setup the program:
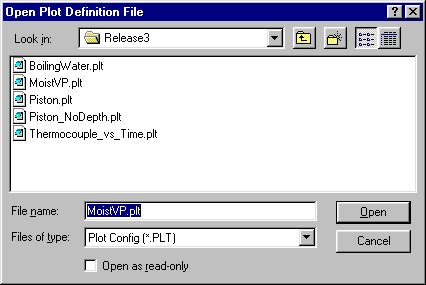
Setup window for the graphical interface to the demonstration.
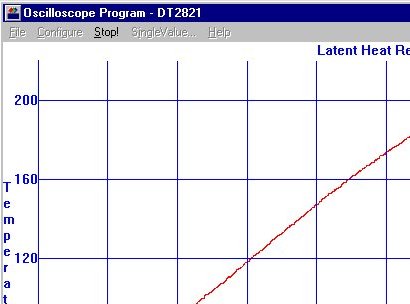
Upper left corner of screen when the graphing program is taking in data and plotting results. Clicking on Stop! freezes the plot and allows you to restart an experiment or display.