SATURATION VAPOR PRESSURE INCREASES RAPIDLY WITH TEMPERATURE
COMPARE T(t) FOR SAMPLES WITH DRY AND SATURATED AIR. REAL-TIME GRAPHICS.
In this demonstration a little water is placed in one beaker. Both are heated slowly in a water bath. Sensors read out T and P for each container and these are plotted on the screen.
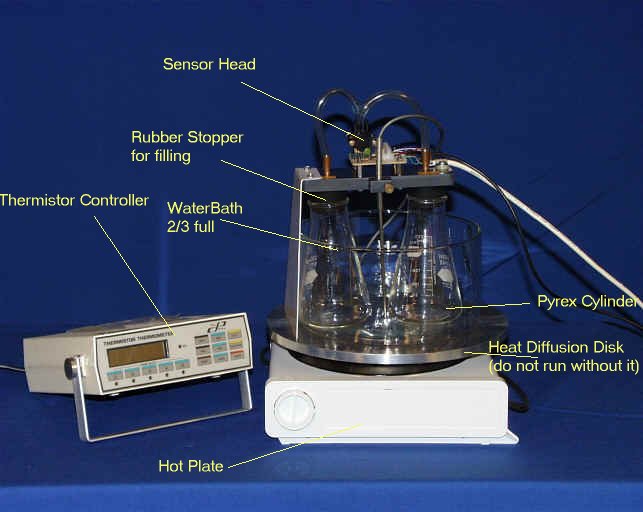
Setup the configuration is shown above. The thermistor controller output is in the form of a cable that connects to the computer interface.
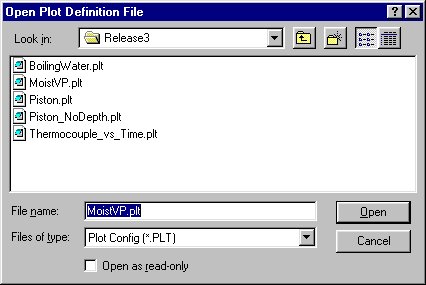
Sample configuration screen.
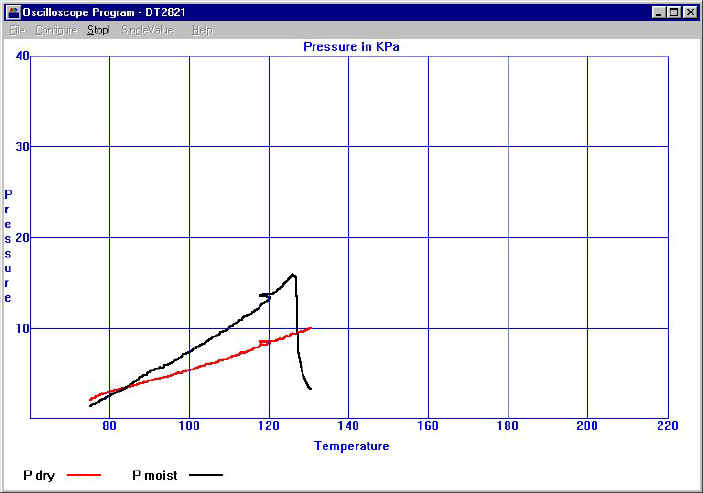
Display screen after start has been pressed. "Stop" would halt the plotting.
The moist P goes up faster than the dry P (exponential vs. linear). You can see where the experiment "popped". Temperature is in F.
This experiment is reasonably quantitative. Can be compared with gas law theory.