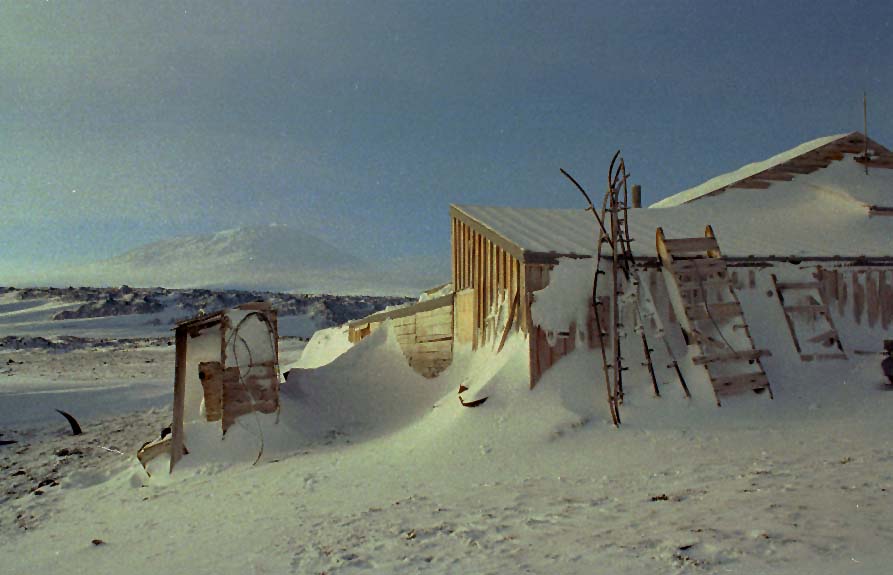
 This
is how we got to McMurdo on August 17 (need I say more?)
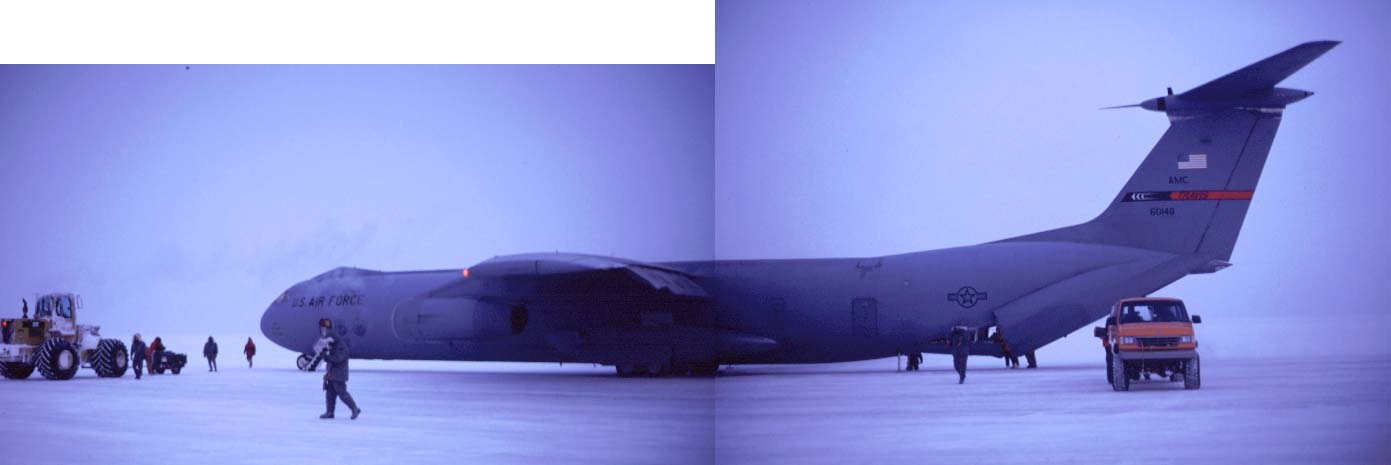
This
is how we got to McMurdo on August 17 (need I say more?)
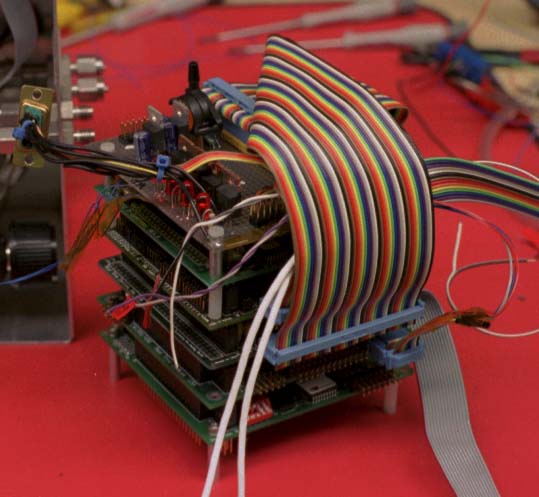 This
is the computer that we used to reduce the weight and power consumption
of our data acquisition system. It isn't better than the one we used in
Kiruna, but it sure is smaller! We had to build a special interface board
(seen here on the top in the same size format as the PC-104 system (RTD)
beneath). The system had 16 channels of 12-bit A/D, 8 digital output channels,
and two high-resolution counters. We didn't have time or money to design
a printed circuit board for the interface board, so what you see here was
hand soldered by Darin at McMurdo only days before the launch (field work
is so fun!). Fortunately, the circuit was simple enough that it worked
without much debugging. It is so dry in Antarctica that one has to use
anti-static mats (although bad practice, we often get away without them
in the lab at Irvine), seen here as the red "background".
This
is the computer that we used to reduce the weight and power consumption
of our data acquisition system. It isn't better than the one we used in
Kiruna, but it sure is smaller! We had to build a special interface board
(seen here on the top in the same size format as the PC-104 system (RTD)
beneath). The system had 16 channels of 12-bit A/D, 8 digital output channels,
and two high-resolution counters. We didn't have time or money to design
a printed circuit board for the interface board, so what you see here was
hand soldered by Darin at McMurdo only days before the launch (field work
is so fun!). Fortunately, the circuit was simple enough that it worked
without much debugging. It is so dry in Antarctica that one has to use
anti-static mats (although bad practice, we often get away without them
in the lab at Irvine), seen here as the red "background".
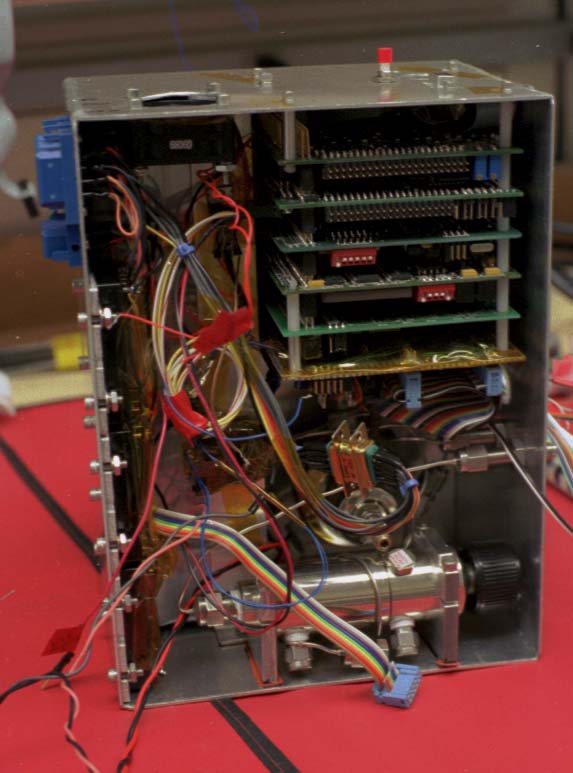 We
inserted the computer into a small box, together with the batteries (hard
to see, but upright in the back left of box), the two gas regulators, and
our DC/DC converters (on the left wall of the box). This arrangement
was not only small and lightweight, but also reduced the need for additional
heaters for the regulators because of all the heat generated by the computer,
power supplies, and batteries. The heat was just about right for the flight,
as the temperature of the box stayed well above freezing for the entire
flight. However, the balloon floated higher than we planned, and at the
low pressures, the box overheated, melting a small DC power supply on the
RTD analog board. As a result, the system stopped working on descent at
about 50 mbar. So we only have data from ascent to 20 mbar and part of
the descent.
We
inserted the computer into a small box, together with the batteries (hard
to see, but upright in the back left of box), the two gas regulators, and
our DC/DC converters (on the left wall of the box). This arrangement
was not only small and lightweight, but also reduced the need for additional
heaters for the regulators because of all the heat generated by the computer,
power supplies, and batteries. The heat was just about right for the flight,
as the temperature of the box stayed well above freezing for the entire
flight. However, the balloon floated higher than we planned, and at the
low pressures, the box overheated, melting a small DC power supply on the
RTD analog board. As a result, the system stopped working on descent at
about 50 mbar. So we only have data from ascent to 20 mbar and part of
the descent.
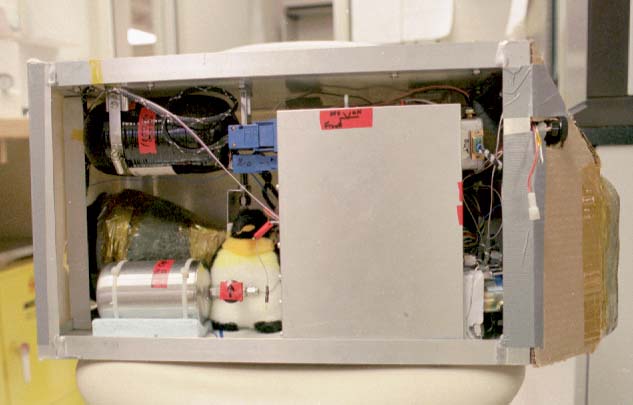 This
view shows the small box inserted into the instrument, which is about 13
inches tall. Also visible in this photo are the lightweight air bottle
(Structural Composites Industries) and the nitric oxide pressure vessel,
which was custom built by Ralph Kolbush. The penguin was purchased at Scott
Base, and it did fly (it was needed to round off the final weight of the
instrument to 18 kg). Air was pulled through the flow tube by an axial
fan housed in a fibreglass duct, seen here behind the NO pressure vessel.
This piece and the inlet (which isn't easily visible here) were constructed
by Nancy Ciszkowski, who worked in my group for a month or so in the July
of 1996 before I left for McMurdo.
This
view shows the small box inserted into the instrument, which is about 13
inches tall. Also visible in this photo are the lightweight air bottle
(Structural Composites Industries) and the nitric oxide pressure vessel,
which was custom built by Ralph Kolbush. The penguin was purchased at Scott
Base, and it did fly (it was needed to round off the final weight of the
instrument to 18 kg). Air was pulled through the flow tube by an axial
fan housed in a fibreglass duct, seen here behind the NO pressure vessel.
This piece and the inlet (which isn't easily visible here) were constructed
by Nancy Ciszkowski, who worked in my group for a month or so in the July
of 1996 before I left for McMurdo.
 The
other side of the instrument appears here. Visible are the lamp modules,
photomultiplier tubes, and the fan duct.
The
other side of the instrument appears here. Visible are the lamp modules,
photomultiplier tubes, and the fan duct.
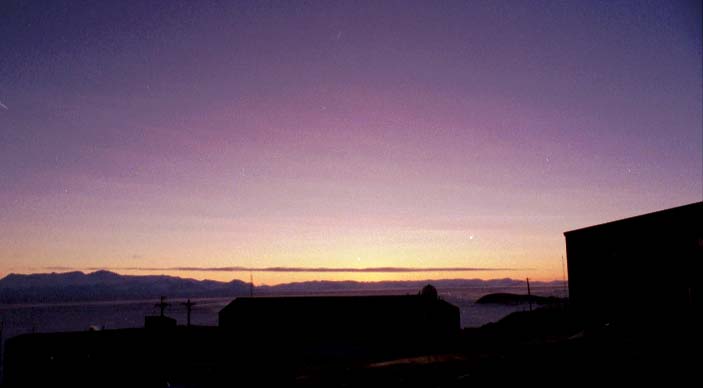 This
is what we went down there for. This is a typical Type I PSC that we observed
for the first couple of weeks at McMurdo. The Italian Lidar nearby told
us all we needed to determine where these were, typically between 14 and
16 km, as the air above that was probably completely denitrified and significantly
dehydrated. This photo was taken two or three hours after sunset. You can
see the wavelike structure to the "cloud" and also the characteristic violet
color.
This
is what we went down there for. This is a typical Type I PSC that we observed
for the first couple of weeks at McMurdo. The Italian Lidar nearby told
us all we needed to determine where these were, typically between 14 and
16 km, as the air above that was probably completely denitrified and significantly
dehydrated. This photo was taken two or three hours after sunset. You can
see the wavelike structure to the "cloud" and also the characteristic violet
color.
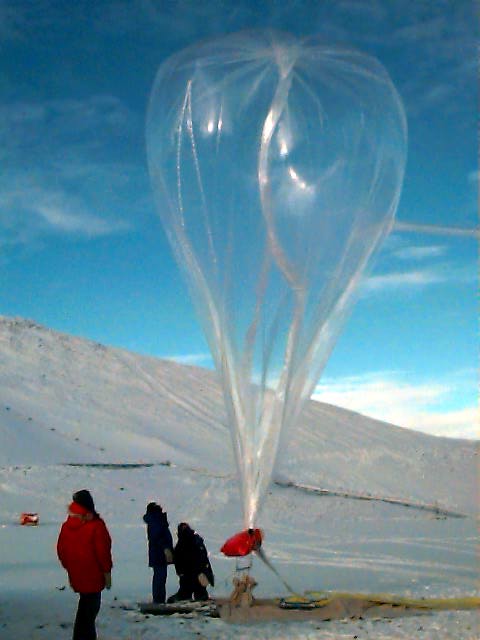 Here
is Ethan Dick's photo of the inflation of the 160,000 cubic foot balloon
that was needed to launch this 50 kg (payload and load line) up to 30 km.
The local time was about 12:00, and there was absolutely
no wind (although we could have launched if it was windy).
Here
is Ethan Dick's photo of the inflation of the 160,000 cubic foot balloon
that was needed to launch this 50 kg (payload and load line) up to 30 km.
The local time was about 12:00, and there was absolutely
no wind (although we could have launched if it was windy).
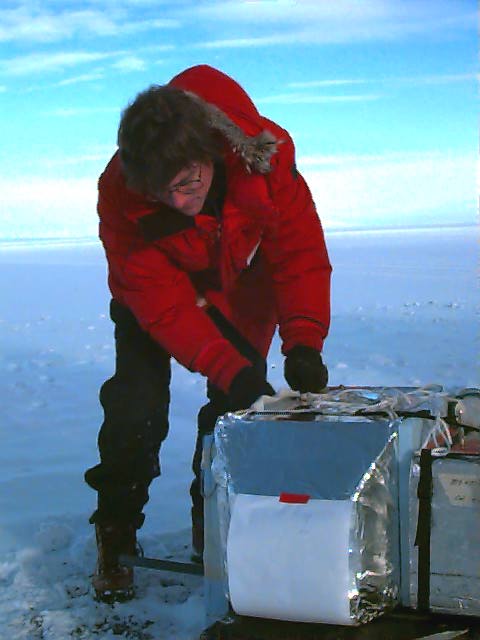 This
is another of Ethan's digital photos, in this case of Darin powering up
the instrument a few minutes before the launch. It was obviously a warm
day (it was about -15 C) because he isn't wearing his hood. The clothes
are NSF standard issue.
This
is another of Ethan's digital photos, in this case of Darin powering up
the instrument a few minutes before the launch. It was obviously a warm
day (it was about -15 C) because he isn't wearing his hood. The clothes
are NSF standard issue.